Where UK road diesel comes from
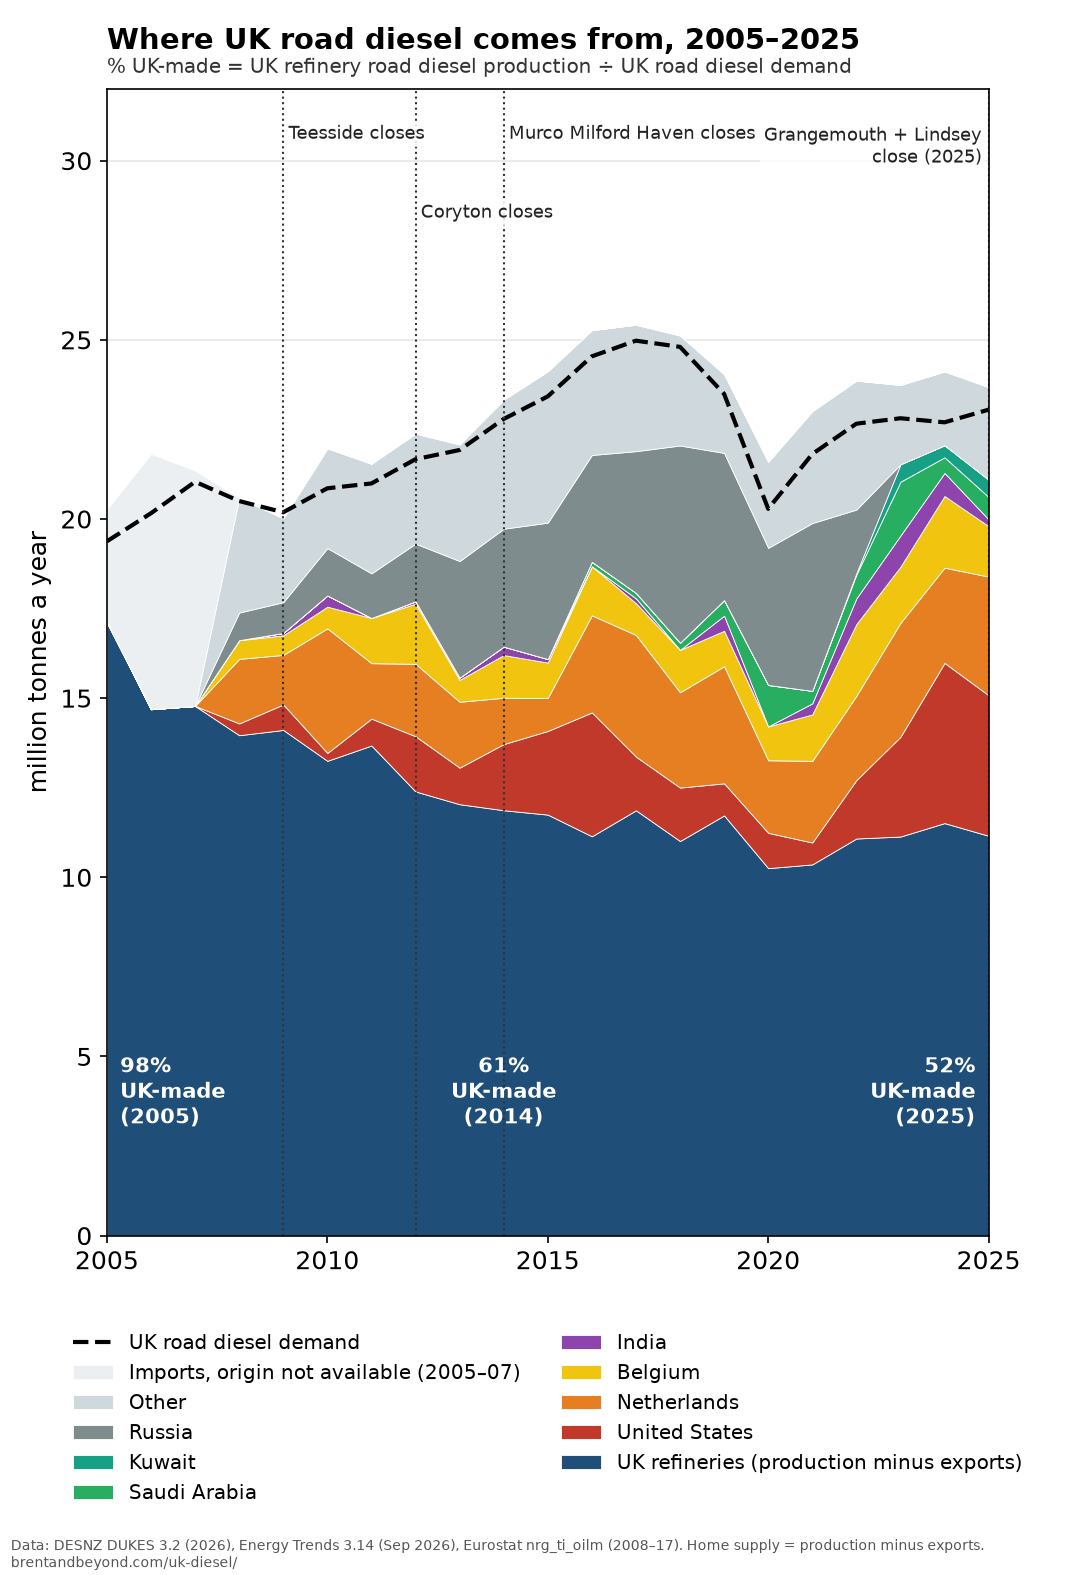
The UK used 23.1 million tonnes (Mt) of road diesel in 2025, about 471 thousand barrels a day. UK refineries made 11.9 Mt of it, 52% of what the country used. In 2005 they made 98%. The rest is imported, in 2025 mainly from the United States, the Netherlands and Belgium.
Diesel at the pump: the RAC's UK average reached a record 200.01p a litre on 2 October 2026 and was 199.9p on 9 October, against 142.38p on 28 February 2026 (RAC Fuel Watch).
Open the refineries layer · All refineries · Download · JSON · Europe oil imports
Where UK road diesel comes from
How much UK refineries make
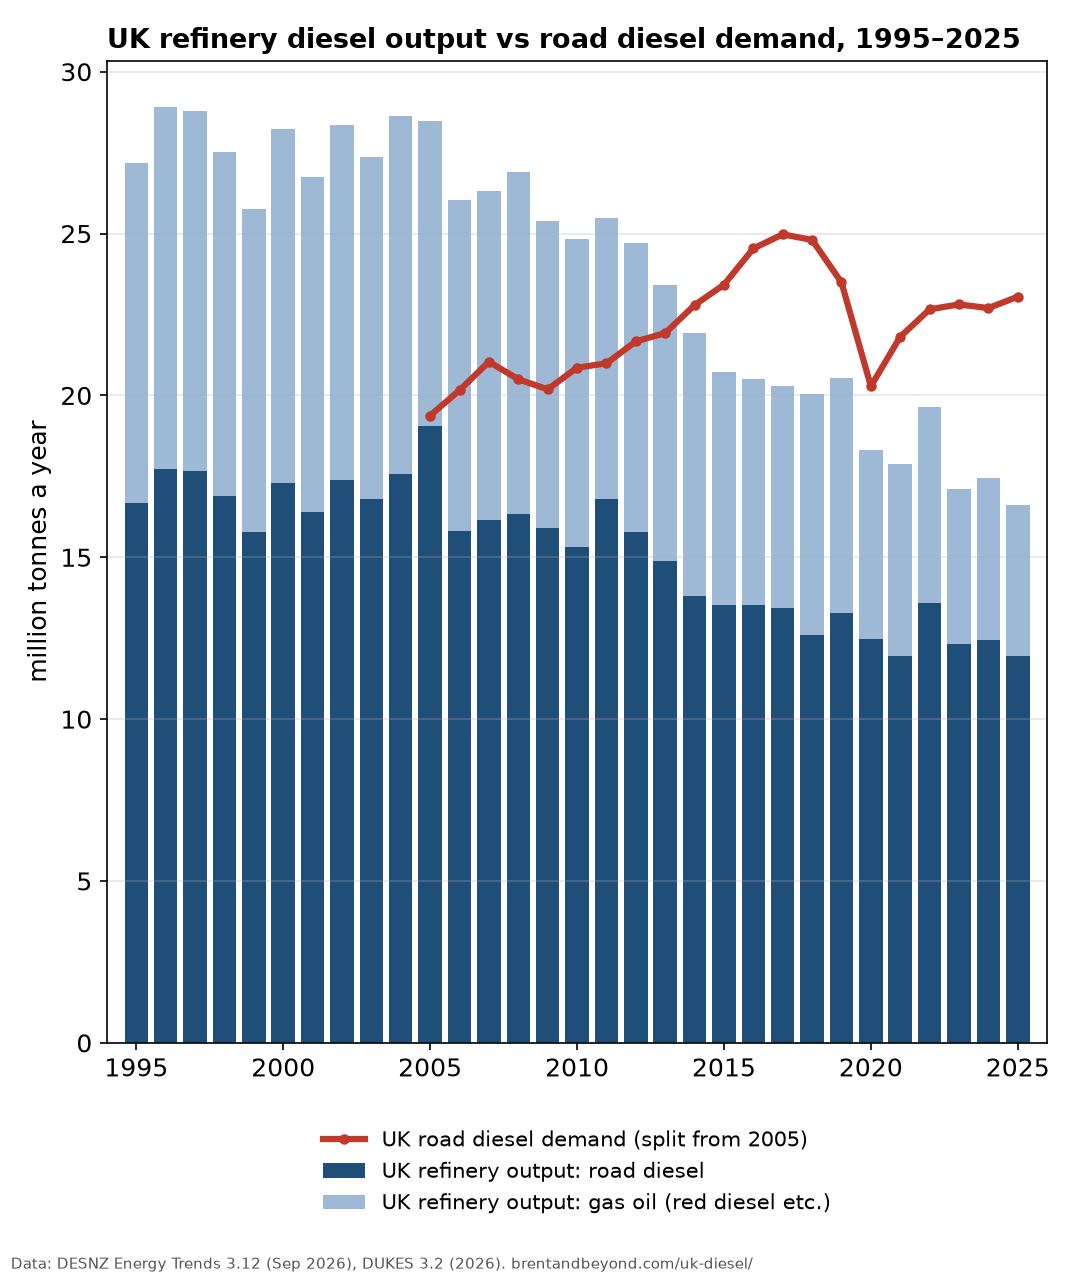
UK refinery output of diesel and gas oil peaked at 28.9 Mt in 1996, the highest year in DESNZ's monthly series, which starts in 1995. In 2025 it was 16.6 Mt, 42% lower. Of that, 11.9 Mt was road diesel and 4.7 Mt gas oil (red diesel and heating oil). In the first 7 months of 2026, to July 2026 (provisional), refineries made 6.9 Mt of road diesel, about 243 thousand barrels a day.
Total crude processed by UK refineries peaked at 114.3 Mt in 1973 and was 49.0 Mt in 2025. Road diesel use rose from 5.04 Mt in 1970 to a high of 25.0 Mt in 2017.
Imports
In 2025 the UK imported 12.5 Mt of road diesel and exported 0.8 Mt. Net imports were 51% of demand, against 6% in 2005. By recorded country of origin, the main sources in 2025 were United States 31%, Netherlands 26%, Belgium 11%, Saudi Arabia 5%, Kuwait 4%. The Netherlands and Belgium are refining and trading hubs, so some of that diesel was made from crude produced elsewhere.
Russia supplied 4.7 Mt (37%) of UK road diesel imports in 2021. Recorded imports from Russia stopped after June 2022, and the UK ban on Russian oil products took effect on 5 December 2022.
Refineries that closed
Dates are when crude processing ended. Sites that carried on as terminals or specialist plants are dated by the end of crude refining. "Reported" means consistent secondary sources; "unconfirmed" means only one source was found.
| Refinery | Crude processing ended | Capacity | Reason given, and sources |
|---|---|---|---|
| Heysham Shell, Lancashire | 1976 (reported) | 2.2 Mt a year (1973) | No reason found in the sources checked. Refinery from 1948; closure year from Grace's Guide, no contemporaneous source found. Grace's Guide |
| Ellesmere Port Burmah, Cheshire | c. 1981 (closure announced 1980) (reported) | about 27,000 b/d (1974) | Burmah Castrol proposed to close the refinery, with the loss of 1,500 jobs (Hansard, written answer, 8 June 1981). The month crude processing ended was not found. Capacity as stated in the Commons, 2 April 1974. Hansard, 8 June 1981 · Hansard, 12 January 1981 · Hansard, 2 April 1974 |
| Belfast BP, Belfast | 1982 (reported) | 1.5 Mt a year (1973) | No reason found in the sources checked. Opened 1964 and converted to a fuel terminal in 1982 (Oil & Gas Journal, 2016; Fuel Oil News, 2013). One Fuel Oil News article (2014) gives 1981. Oil & Gas Journal, 2016 · Fuel Oil News, Sept 2013 |
| Isle of Grain (Kent) BP, Kent | August 1982 | 10.9 Mt a year (1973) | Announced in 1981; reported reasons were lower demand for oil products and surplus refining capacity in Europe. Part of the site later became the Grain LNG terminal. BP timeline (Downstream Download) · Historic England |
| Milford Haven (Esso) Esso, Pembrokeshire | 1983 | about 180,000 b/d after 1973 expansion | Esso closed it to concentrate on its Fawley refinery, at a time of surplus refining capacity in Europe. BBC News, 2014 |
| Llandarcy BP, Neath Port Talbot | 1985 (last crude units by January 1986) (reported) | 8.3 Mt a year (1973) | BP announced in April 1985 that it would cut the refinery back to specialist oil products, citing surplus UK refining capacity. The Angle Bay crude terminal and pipeline closed in 1985. Specialist products (lubricants) carried on until 1998. That 1998 date is the end of the site, not of crude refining. Angle local history (Pembrokeshire) · BBC News, 2014 |
| Teesport (Shell) Shell, Redcar and Cleveland | 1980s; 1989 given for mothballing (unconfirmed) unconfirmed | 6.0 Mt a year (1973) | No reason found in the sources checked. Grace's Guide says "1980s"; 1989 comes from one secondary source. No contemporaneous source found. Grace's Guide |
| Milford Haven (Gulf) Gulf, Pembrokeshire | 1997 | 115,000 b/d | No reason found in the sources checked. The site later became the Dragon LNG terminal. BBC News, 2014 |
| Shell Haven Shell, Essex | December 1999 (announced 1998) | 10 Mt a year (1973); later figures differ | Shell cited surplus European refining capacity and weak margins (Oil & Gas Journal, 1998). The site is now the London Gateway port. Oil & Gas Journal, 1998 |
| Teesside (North Tees) Petroplus, Stockton-on-Tees | March 2009 (made permanent 9 Nov 2009) | 117,000 b/d | "Given the current unfavorable market environment and capital expenditures required to maintain refinery operations at Teesside, we have decided to suspend refinery operations" (Petroplus, 9 Nov 2009). Crude purchases stopped at the end of March 2009. The site carried on as a terminal and storage depot until Petroplus failed in 2012, which is where the "2012" date comes from. Greenergy bought it in 2012. Bunker Index, 7 May 2009 · Process Engineering, 9 Nov 2009 |
| Coryton Petroplus, Essex | 6 June 2012 | about 220,000 b/d | The owner went into administration on 24 January 2012. The administrators did not accept any offer for it as a going concern and announced on 28 May 2012 that crude refining would end. The site became an import terminal. The "2011" date seen elsewhere is wrong: refining ended on 6 June 2012 (OFT merger decision). OFT decision (gov.uk) · BBC News, 26 June 2012 |
| Milford Haven (Murco) Murco (Murphy Oil), Pembrokeshire | November 2014 | 135,000 b/d | An agreed sale to Klesch fell through; Murphy then shut the refinery and kept the site as a storage terminal. Puma Energy bought it in 2015. BBC News, Nov 2014 · Reuters, Nov 2014 |
| Grangemouth Petroineos, Falkirk | 29 April 2025 | about 150,000 b/d | Petroineos said the refinery was losing about US$500,000 a day and could not compete with larger, more modern refineries in the Middle East, Africa and Asia. The site is now an import terminal. Reuters, 29 Apr 2025 · BBC News, 29 Apr 2025 |
| Lindsey Prax (Total until 2021), North Lincolnshire | end of July 2025 | 113,000 b/d | Its owner became insolvent on 30 June 2025. The Official Receiver found "no credible offers" for the refinery as a whole (written statement, 22 July 2025). Phillips 66 agreed to buy the site assets on 5 January 2026. Refined products continued to be sold for some weeks after crude processing stopped. Written ministerial statement HCWS882 · Insolvency Service, 5 Jan 2026 |
Date rule: the year (and month where known) crude oil processing ended, not when the site later stopped as a terminal or specialist plant. Specialist sites that never made road fuel at scale are left out, for example Nynas Dundee (bitumen, closed 2013).
Refineries still running
Nameplate crude capacity, DESNZ, July 2025:
- Fawley (ExxonMobil (Esso)): 13.3 Mt a year
- Humber (Phillips 66): 11.9 Mt a year
- Pembroke (Valero): 10.8 Mt a year
- Stanlow (Essar (EET Fuels)): 10.2 Mt a year
- Eastham (specialist, bitumen) (Eastham Refinery Ltd): 1.2 Mt a year
- Harwich (specialist) (Haltermann Carless): <1.0 Mt a year
That is four large fuel refineries, down from six at the start of 2025. Details and map.
Year by year (million tonnes of road diesel)
| Year | Made in UK | Imports | Exports | Demand | UK-made share |
|---|---|---|---|---|---|
| 2005 | 19.1 | 3.1 | 1.9 | 19.4 | 98% |
| 2006 | 15.8 | 7.1 | 1.1 | 20.2 | 78% |
| 2007 | 16.1 | 6.6 | 1.4 | 21.0 | 77% |
| 2008 | 16.4 | 6.6 | 2.4 | 20.5 | 80% |
| 2009 | 16.0 | 6.0 | 1.9 | 20.2 | 79% |
| 2010 | 15.4 | 8.1 | 2.1 | 20.9 | 74% |
| 2011 | 16.8 | 7.9 | 3.1 | 21.0 | 80% |
| 2012 | 15.8 | 10.1 | 3.4 | 21.7 | 73% |
| 2013 | 14.9 | 10.4 | 2.8 | 21.9 | 68% |
| 2014 | 13.8 | 11.5 | 1.9 | 22.8 | 61% |
| 2015 | 13.5 | 12.3 | 1.8 | 23.4 | 58% |
| 2016 | 13.5 | 14.5 | 2.4 | 24.5 | 55% |
| 2017 | 13.4 | 14.2 | 1.6 | 25.0 | 54% |
| 2018 | 12.6 | 14.1 | 1.6 | 24.8 | 51% |
| 2019 | 13.3 | 12.3 | 1.6 | 23.5 | 57% |
| 2020 | 12.5 | 11.3 | 2.2 | 20.3 | 62% |
| 2021 | 11.9 | 12.6 | 1.6 | 21.8 | 55% |
| 2022 | 13.6 | 12.8 | 2.5 | 22.7 | 60% |
| 2023 | 12.3 | 12.6 | 1.2 | 22.8 | 54% |
| 2024 | 12.5 | 12.6 | 0.9 | 22.7 | 55% |
| 2025 | 11.9 | 12.5 | 0.8 | 23.1 | 52% |
Sources and caveats
- Balances: DESNZ DUKES 2026, chapter 3 (2025 data, published July 2026). Monthly output and imports by origin: DESNZ Energy Trends section 3, September 2026 release (data to July 2026, latest month provisional). Origins 2008–2017: Eurostat nrg_ti_oilm.
- Road diesel (white diesel, formerly DERV) is split from gas oil (red diesel) in DESNZ balances only from 2005.
- Imports by country of origin as recorded: Eurostat nrg_ti_oilm (product O46711 road diesel, partner = country of origin) for 2008-2017, DESNZ Energy Trends 3.14 for 2018 on. The two sources differ by a few per cent in overlapping years; the Netherlands and Belgium are refining and trading hubs. Before 2008 the origin split is not available here.
- Barrels a day use 7.46 barrels per tonne (approximate for diesel).
- Before 1995 there is no open product-by-product refinery output series, so the long run uses total crude throughput and road diesel deliveries (DUKES 3.1.1, 3.1.2).
Last updated: (data). Page built 2026-10-19.