UK gas: where it comes from, and how full storage is
Where Britain's gas comes from right now, how full its storage is, and the monthly picture. The live figures come from National Gas Transmission, which runs the National Transmission System, and refresh every 12 minutes. Norway's share at St Fergus is an estimate from Gassco's nominations.
Open the gas terminals layer · Gas terminals · Gas storage · Europe gas imports · Download
UK gas supply right now
Loading live UK gas data…
How full is UK gas storage?
Loading live UK gas data…
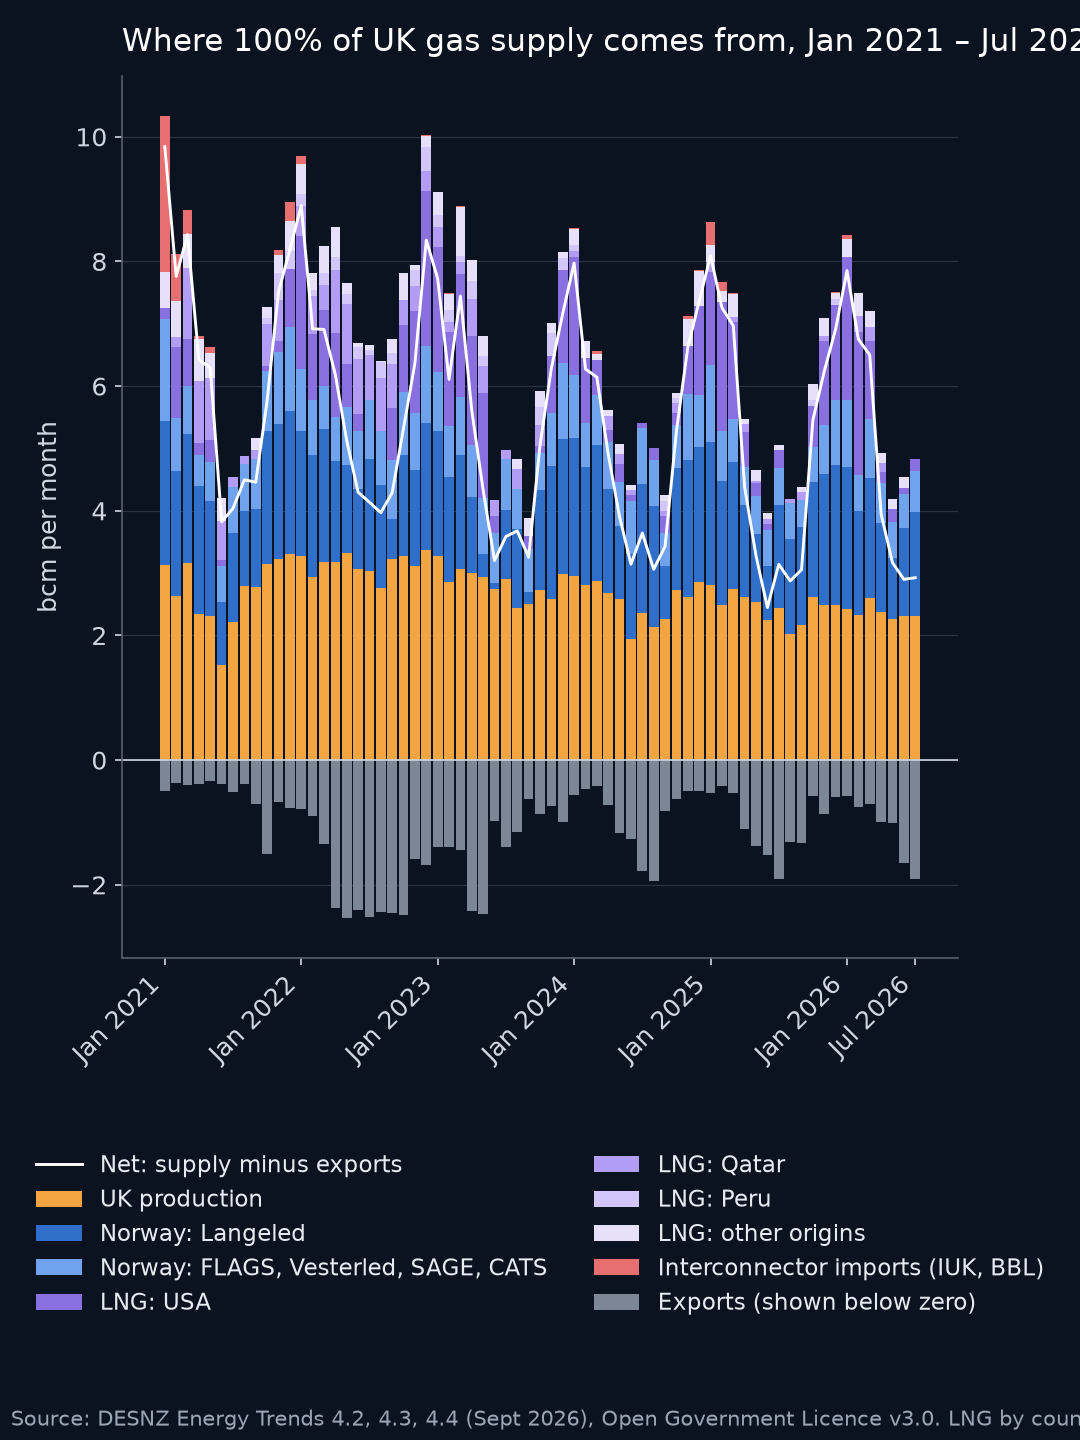
Month by month: 100% of UK supply
In July 2026 the UK system took in 4.84 bcm: UK production 2.32 bcm (48%), Norwegian pipeline gas 2.33 bcm (48%, of which Langeled 1.67), LNG 0.19 bcm (4%) and interconnector imports 0.00 bcm. Exports were 1.91 bcm, mainly to Belgium (1.08), the Netherlands (0.52) and Ireland (0.31).
Sources and how the figures are made
- Live supply and demand: Data: National Gas Transmission, Gas Data Portal, instantaneous flows (published every 12 minutes, shown with their publication time in UK time). Supply uses National Gas's terminal totals, which add up to its total supply; onshore storage sites are added separately. Isle of Grain is counted from its terminal total, because its entry-point rows can read zero while the terminal total does not.
- Norway at St Fergus (estimate): Gassco real-time exit nominations for "St.Fergus" plus "Fields Delivering into SEGAL", in MSm³/d (close to mcm/d), capped at the St Fergus terminal flow. Nominations are plans, not metered flows; Gassco publishes them for information only. Langeled at Easington is metered by National Gas.
- "Gas day so far": the gas day runs 05:00 to 05:00 UK time. Each 12-minute reading we collect is weighted by the time to the next one (at most 30 minutes), so the average covers only the hours we have readings for, and says how many.
- Storage: Data: National Gas Transmission, Gas Data Portal, Storage, opening stock and available capacity per site, published daily around 16:00 UK time. Capacity = stock + available capacity. Last year and the 2021–2025 average use National Gas's aggregate stock level for the same date; the portal keeps five years of history.
- Monthly: DESNZ Energy Trends section 4, September 2026, tables 4.2, 4.3 and 4.4 (Open Government Licence v3.0). 1 bcm ≈ 10.9 TWh.
Last updated: (data). Page built 2026-10-19.